
In the face of rapidly changing nature, the insurance and engineering industries are facing severe challenges:
The Difficulty of Insurance: How to achieve rate determination, accurate underwriting, and efficient claims settlement when data accuracy is insufficient, updates are lagging behind, and risks are difficult to keep up with, and disasters are disconnected from the target?
Concerns about Engineering: Long term construction is difficult to withstand sudden disasters, a single risk dimension is difficult to withstand complex impacts, and it is difficult to identify specific construction sites on a macro map. How can risk prediction, scientific protection, and safety guarantee break through?
Pain points are the starting point, risks need to be 'seen'! MINTAIAN Innovation has launched an industry level natural disaster risk map, empowering the entire risk reduction chain with intelligent technology, making intangible risks "quantifiable, interventionable, and traceable", injecting precise prevention and control into the industry as a booster!
A picture in hand, risks at a glance: the core value of the Mintai An Thousand Mile Eye Risk Map
MINTAIAN is well aware that true risk reduction begins with Accurate insight , accomplished by Dynamic intervention Finally Continuous optimization . MINTAIAN Qianliyan Risk Map It is precisely to achieve full cycle risk control of "prevention before, intervention during, and optimization after the event" Core engine :
Pre emptive prevention: insight into opportunities and prevention in advance
Accurate target risk classification: Deeply integrate historical disaster data, geographical features, and exposed material attributes (such as building structure and asset density) to construct a fine grid of high/medium/low-risk areas, providing differentiated rate determination and accurate underwriting decisions Solid data foundation.
Intelligent underwriting risk control: Automatic warning for high-risk areas, supporting insurance companies to set underwriting conditions in advance (such as mandatory disaster relief renovation), limit the upper limit of insurance coverage, intercept high-risk accumulation from the source, and achieve risk management 'Proactively reduce' (For example, buildings in high-risk earthquake areas are not insured without reinforcement).
Intervention during the event: instant response, turning danger into safety
Minute level dynamic warning: Integrate real-time meteorological (typhoon, rainstorm) and hydrological data to generate dynamic risk thermodynamic chart. Accurately push warning information and emergency guidance, coordinate with surrounding shelters and rescue equipment locations, and work against time to safeguard safety.
Scientific resource scheduling: When a disaster occurs, quickly locate the affected area of high-value targets, coordinate with emergency departments to prioritize the allocation of rescue resources (such as quickly allocating pumping equipment for factories surrounded by floods), and dynamically optimize stop loss strategies based on the risk level of the targets to minimize the spread of losses.
Post optimization: Data feedback, intelligent driving for the future
Model accuracy verification: Comparing actual disaster losses with map predictions, conducting in-depth analysis of deviations, Continuous iterative optimization Risk assessment models make the next prevention more precise and effective.
Service closed-loop upgrade: Identify weak links in risk control, upgrade map data dimensions in a targeted manner, and launch customized risk reduction services, Form a complete closed loop of "evaluation intervention optimization".
MINTAIAN Qianli Eye Risk Map: Five Hard Core Functions, Creating Industry Barriers
1. Meteorological simulation: Based on real-time temperature and humidity data and integrating GIS technology, Accurate simulation The regional microclimate, airflow movement, and precipitation distribution make disaster risk assessment "predictable".
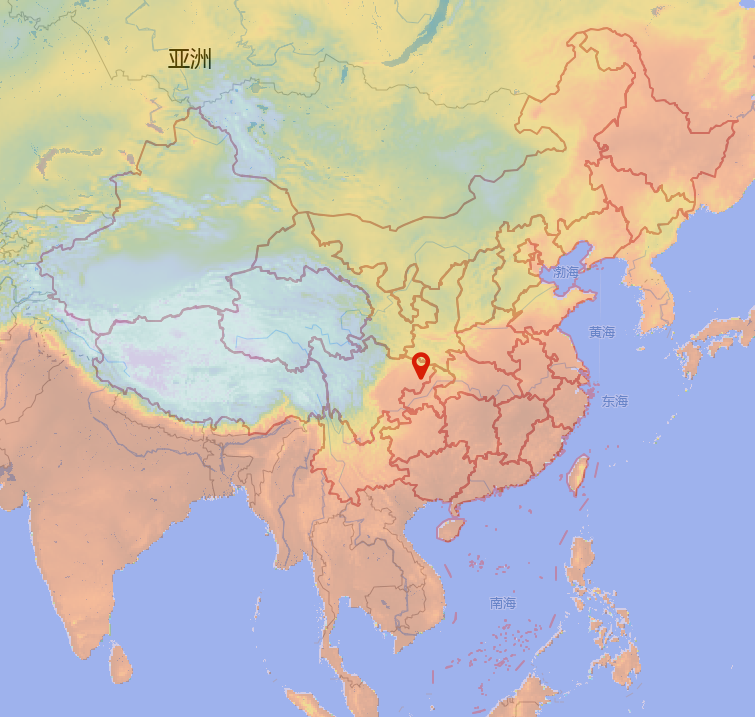
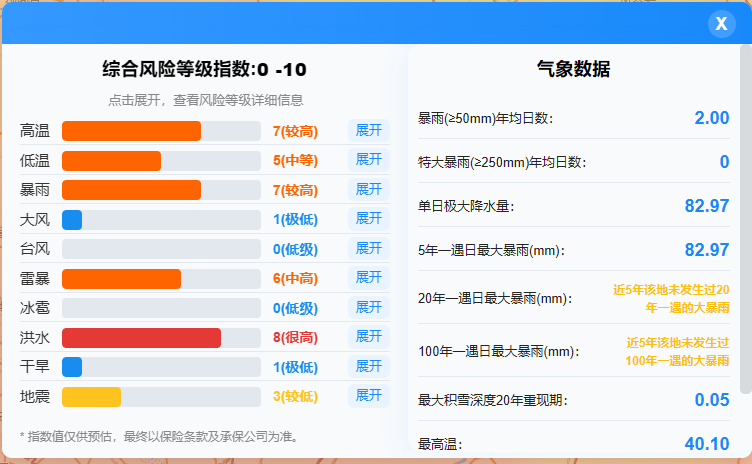
2. Calculation of Disaster Index: Integrating meteorological, geological historical data, and population economic exposure indicators, intelligent algorithm One click output of segmented disaster index and comprehensive risk index, providing pricing for underwriting and disaster prevention deployment Scientific Quantitative Scale .
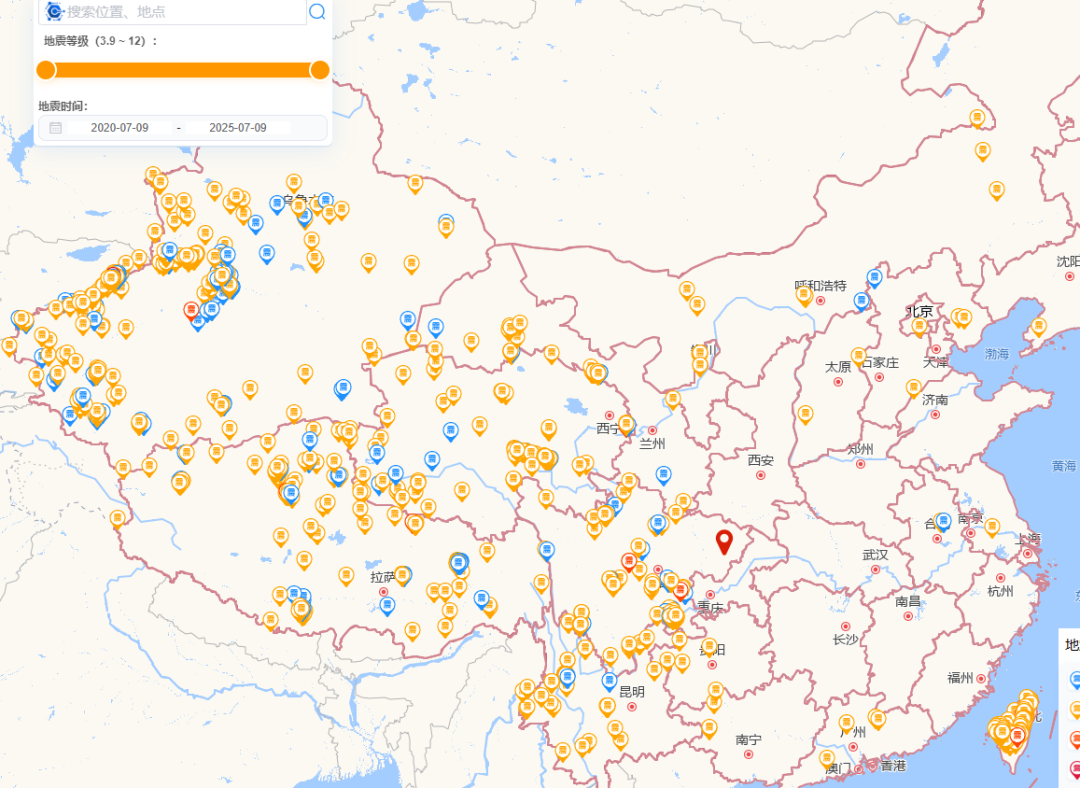
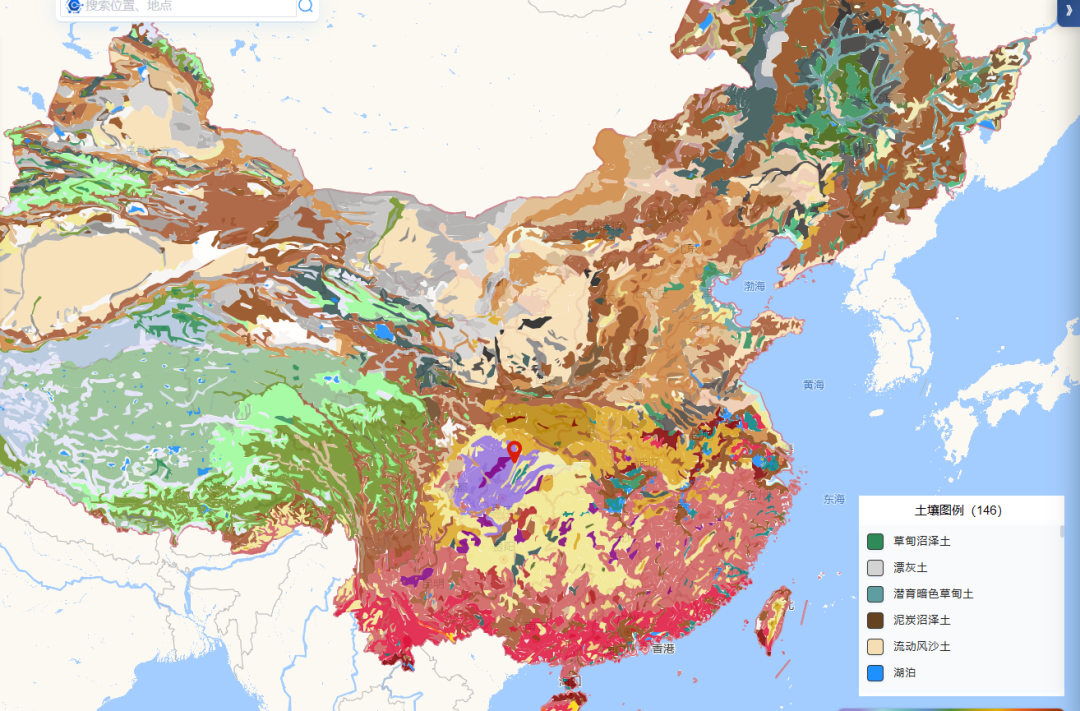
3. Geological hazard assessment: Construct a geological database (historical earthquakes+soil rock layers) and combine it with a geological stability model, Scientific prediction The probability and impact range of disasters such as landslides and earthquakes provide key basis for project site selection and protection reinforcement.
4. Accurate meteorological forecasting: Relying on satellite cloud images and radar echoes, applying AI and numerical models, Advance forecast In the coming hours to days, township level precipitation and wind power will accelerate risk response.
5. Disaster scenario simulation:
a. Typhoon simulation: Based on the path data, Dynamics Wind distribution and storm surge impact provide visual support for emergency plans.
b. Flood simulation: Integrating hydrological and topographic data, rehearsal The range, depth, and velocity of flood inundation under different rainfall levels help to accurately formulate flood prevention plans.
Choosing the Mintai An Qianliyan Risk Map means choosing future competitiveness
For the insurance industry: Say goodbye to passive compensation and embrace active prevention and control, improve actuarial accuracy, optimize underwriting strategies, accelerate claims response, reduce compensation costs, and significantly enhance risk selection and pricing capabilities.
For the engineering industry: Breaking through the blind spots of long-term risks, predicting the impact of sudden disasters during the construction period, guiding the protection of key construction sites (foundation pits, scaffolding), integrating engineering parameters to achieve a "disaster structure" linkage assessment, and truly controlling risks Landing on every inch of the construction site .
Application Scenario: Taking engineering insurance as an example, MINTAIAN Qianliyan Risk Map By deeply integrating historical meteorological data with the geographical location of the project, key support is provided for various aspects of engineering insurance.
In the pricing stage of insurance, the underwriting personnel can adjust the premium rate and underwriting limit according to high-risk areas;
In the risk assessment process, assessors can use maps to identify weak links and provide recommendations;
In policy design, exclusive clauses can be set for specific weather events;
In the claims management stage, it is possible to quickly locate the affected area, optimize loss assessment and resource allocation;
It can also be used for post risk mitigation, analyzing the causes of losses, and guiding future protective measures.
The risk map is not just a "map", but also a smart engine that drives risk reduction. MINTAIAN continues to improve its maps with the power of satellite remote sensing, the Internet of Things, and AI real-time and granularity Promote its continuous evolution from an "auxiliary tool" to a "core decision-making center".
Risk takers win the future!
Business contact information: 19926659982- Manager Wang
 WeChat official account
 WeCom
WeCom